S10 Create and interpret flow charts

This area of the audit has been marked at '1' meaning very little knowledge if not any at all.
____________________________________________________
____________________________________________________
What I have learnt and what I now understand
So far in our taught sessions we have already been introduced to Flowol, PICAXE and Circuit wizard and with all of these programmes I am aware that you can create flow charts to display systems. See S5 use software for circuit simulation to see my learning process and development in flow charts using simulations.
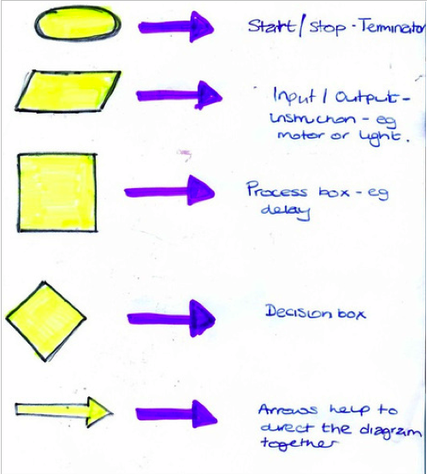
I now understand that flow charts show how control systems work, I soon discovered that you do not necessarily need to use a programme like PICAXE to demonstrate a flow chart you can even draw it by hand because every chart uses specially shaped boxes to show different stages of how a system might work. These shapes are universal in the systems and control language and can be seen below.
I have begun to create some basic circuits and flow charts and have started to understand this area of the audit even more. It was obviously helpful that we were introduced to the programmes before hand during a session with Dean. I found that it was just a case of transferring existing knowledge over, and now I know that with every chart or system there is always a.....
INPUT ------> Process ------> OUTPUT
The input's processes and output's are represented using the shapes above.
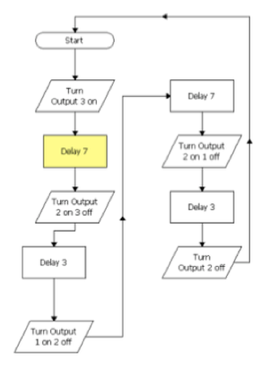
Below are two examples of flow charts using different programmes however as you can see they use the same boxes to symbolise the inputs and so forth. I was able to identify this at quite a early stage and so thought that it is important to display within my development. The first flow chart was fabricated using Flowol and the second is a PICAXE flow chart. Generally speaking I feel that as programmes they are both easy to use so I did not have any problems with them, it just took a while for me to learn where the different tools were and how to navigate through the software.
Interpreting a flow chart
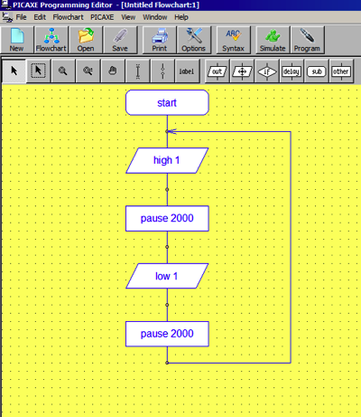
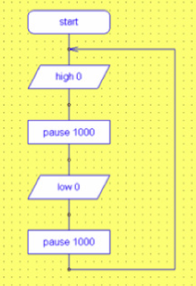
This is a flow chart that I have created using PICAXE. I am going to explain what is going on to show that I now have a deeper understanding within this area of the audit.
- So the first part of the flow chart begins with a 'TERMINATOR' this starts the system.
- The parallelogram which is labeled high 1 represents INPUT 1 on in other words it is turning the LED on.
- The system then pauses for 2seconds, 2000 represents 2seconds, so 3000 will translate to 3seconds. This is a decision where the system decides the next step.
- The next stage in the system is turning INPUT 1 off. Low meaning off.
- The system then pauses for another 2seconds
- The sequence starts again and this is indicated through the arrows which links from the end back to the start. The circuit is on a constant loop and will be unless changed.
___________________________________________________________________
Analyis of new gained knowledge and the next step
When I first approached this area of the audit I had no knowledge of how to create or interpret flow charts. For this reason it was initially graded a '1' meaning very little knowledge if not any at all. I feel that I am much more comfortable now with this content and hopefully this can be displayed through my engagement.
I felt that I was most successful as a learner during this time when I was able to transfer the knowledge that I had gained from the previous taught sessions. I had already been introduced to PICAXE when coding a seven segment display so I already understood the basics of the software. I felt more successful and noticed that my development was a lot faster because I was learning visually, I know that I am a visual learner so the symbols and shapes helped me to understand the theories behind how the circuit works. The terminology almost confuses me more so I felt that it is good that they use these symbols to represent different aspects of the circuit or system.
I think creating the diagrams also made me understand more about how a system works and how important each section is in order for a circuit to function properly. It also started to make me think about how I could create my own flow charts for my project in the systems and controls module.
Although, I would say that I was successful during this time of exploring flow charts and finding out how they are created and work, in retrospect I know that I could have dug deeper by creating more complicated flow systems. If so, this would have obviously would contributed to a better understanding within the area aided further development. However, I think that this could be part of my next step because we will need to create some kind of flow charts in our projects and therefore a light going on and off will most likely not be suitable so I expect that I will be able to engage further and hopefully at a later date I can illustrate this within my further development.
So my next step now is to try and create more complicated or complex flow charts for my own work in the systems and control module. Perhaps I can use various inputs and processes so that it can help with my development and understanding. If this is the case I will most certainly show this development and process within this area of the audit.
___________________________________________________________________

Further Development
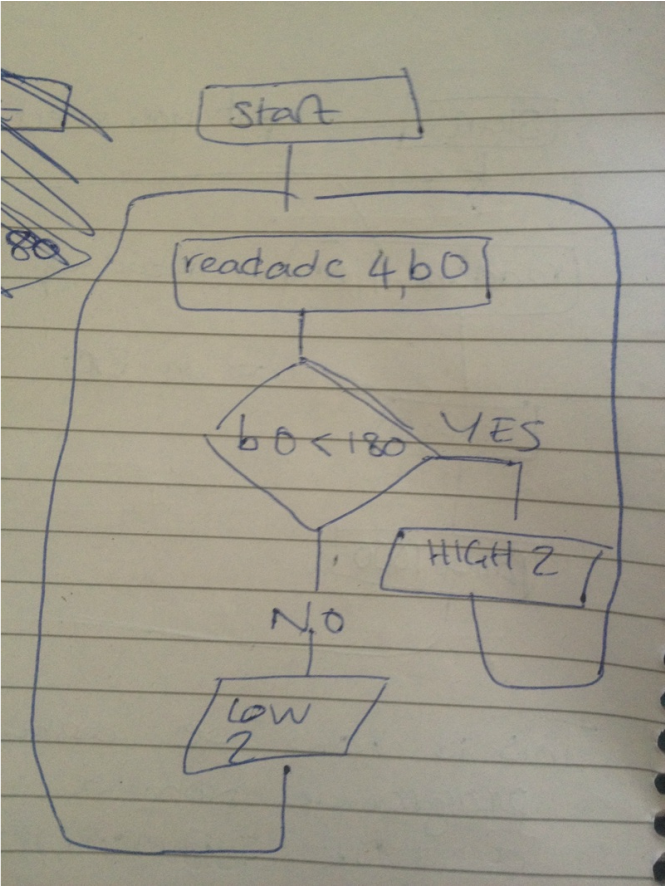
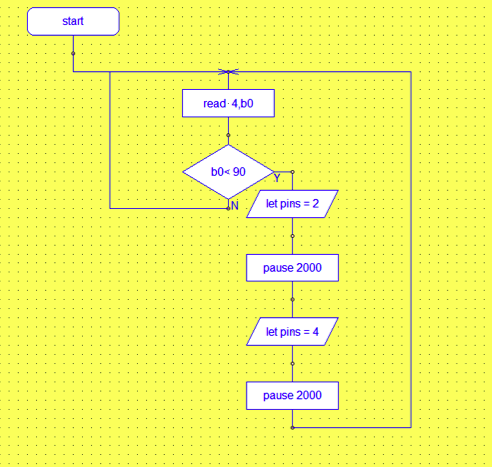
In my systems and control project I have decided to create a Nintento controller which includes a LDR and two LED'S. In order to create the programme I have used PICAXE to allow my LRD to read the levels of light and depending on that reading it will turn the LED'S on. Below is a image that demonstrates a flow chart of the circuit at work.
The circuit starts and gets input 4 to read the levels of light, the system then makes the DECISON to either turn the LED's on or not depending on the amount of light that has been coded in. If yes then it turns on one LED pauses for two seconds and then turns on another LED. The circuit then loops again and goes back to the LDR so that it can read the levels of light to decided whether or not it needs to keep the lights on.
Generally speaking I feel that I have really come to terms with this area of the audit. For me as a learner I find that flow charts are really logical to understand and it is quite easy for you to spot any mistakes and fix a problem if need be which then helps you to develop further in your tasks. I have also learnt that when creating flow charts you should always try and look for the simplest way to fabricate the system using a diagram, sometimes you can end up with lots of boxes on the page and as a result can become slightly overwhelming.

Professional Year Further Development
Today in the student lead session I realised that even though I have debugged an LRD before I actually forgot what the digram is in order to measure the levels of light/temperature/sound ect. Therefore I have redrawn how it would appearing using software so that it can be a reference if I am stuck again in the future.
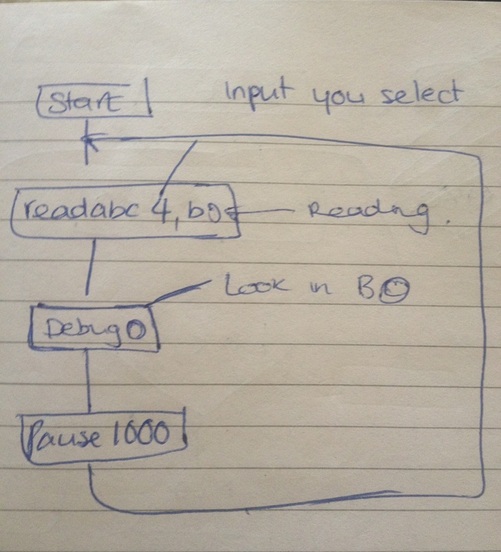
So this picture below shows the readings from the debug ... the numbers represent the levels of Light. In this case > means greater than and means < less than. So it is asking whether the levels of light are less than 180, if Yes then turn on output 1 if no turn off output 2.